
Using the Market Psychology Chart to Trade Smarter
A market psychology chart is less of a technical tool and more of a roadmap to the human heart. It visually captures the rollercoaster of emotions that investors collectively experience during a market cycle, showing how feelings like euphoria and despair are the real engines behind massive price swings, bubbles, and crashes.
Decoding the Narrative of Market Emotions
Think of this chart as a storybook for the market's mood. While most charts focus on cold, hard data like price and volume, the market psychology chart tells the human side of the story. It reveals the predictable, and often irrational, wave of emotions that dictates what people do with their money.
At its core, this chart is a powerful lens for understanding how to analyze market trends by focusing on the emotional triggers behind the price action. This isn't some new-age concept, either. The idea that mass emotion moves markets has been around for centuries.
Ever hear of the Dutch Tulip Mania in the 1600s? That’s a classic, real-world example. Speculative fever drove the price of a single tulip bulb to astronomical levels—more than a house at the time—before the bubble popped, wiping out fortunes overnight. It's a timeless lesson in how collective psychology can completely disconnect an asset's price from its actual value.
Key Takeaway: The market psychology chart is really about tracking the predictable patterns of human greed and fear. These two emotions are the constants that repeat themselves time and again, whether you're looking at stocks, real estate, or crypto.
The Core Components
To really get what this chart is showing you, you have to see how sentiment, emotion, and price are all tangled together. They create a powerful feedback loop that shapes the entire market cycle. If you're new to this, learning the basics of how to read cryptocurrency charts is a great first step, as it helps you see how these psychological forces show up as patterns on the screen.
The image below breaks down this relationship perfectly.
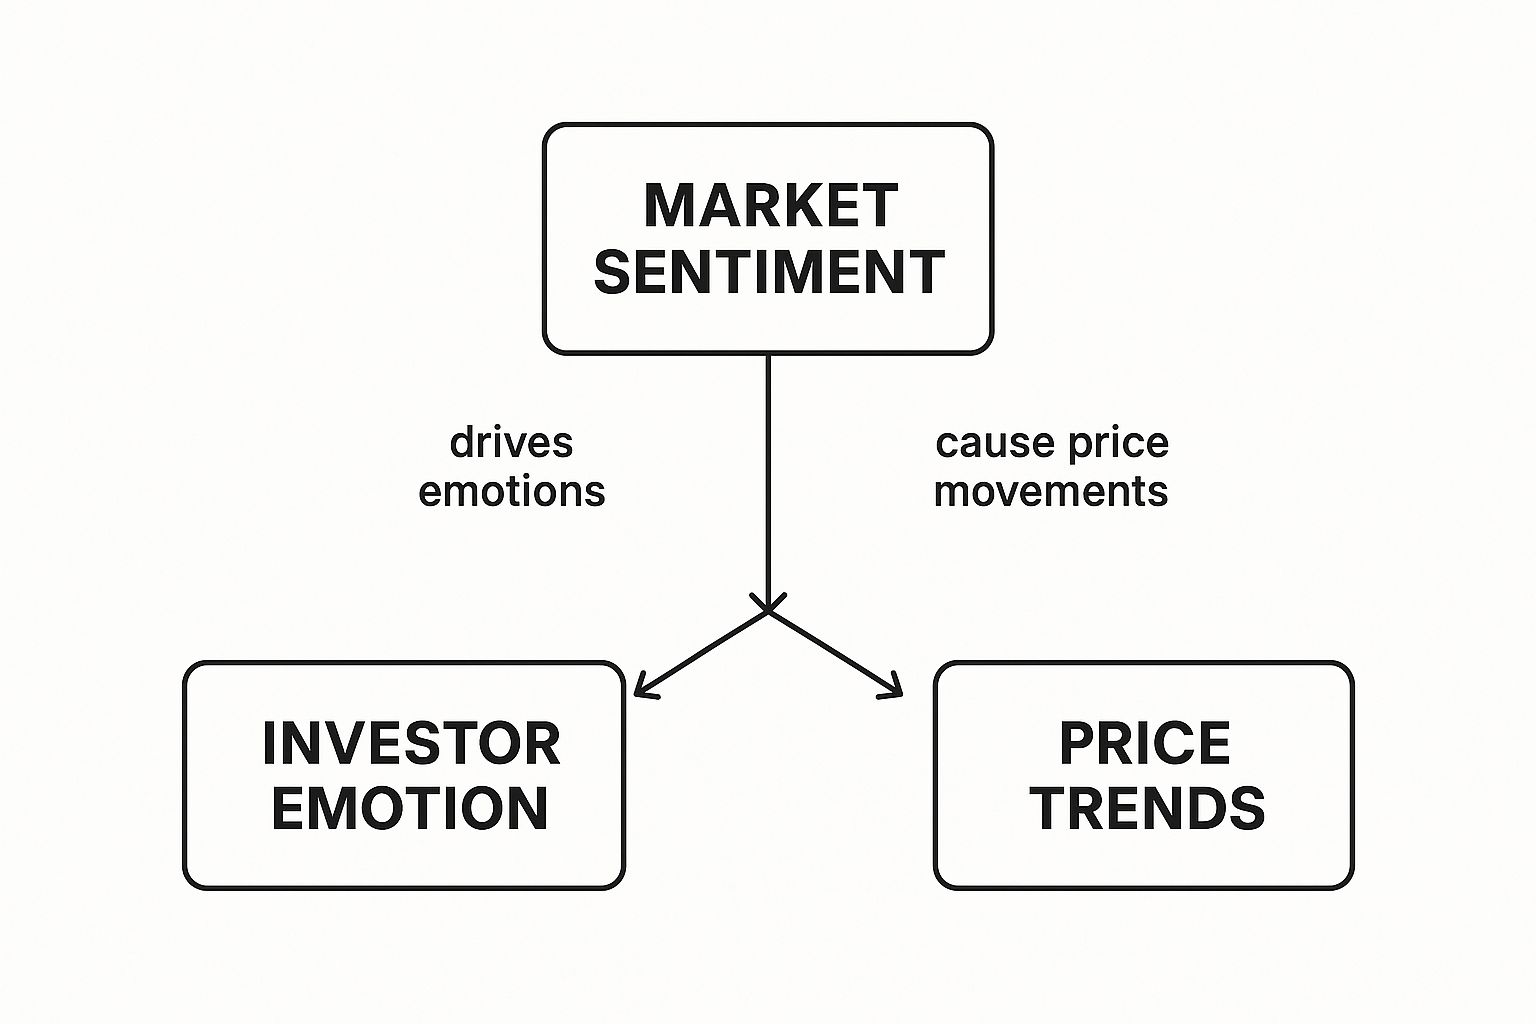
As you can see, a change in the overall market sentiment lights the fuse. This sparks strong emotions in individual investors, and those emotions lead directly to the market actions that move prices up or down.
To make this even clearer, here’s a quick rundown of the emotional stages you see on the chart.
The Emotional Phases of a Market Cycle
This table provides a snapshot of the key emotional stages, linking them to the typical behavior we see from investors at each point in the cycle.
| Market Phase | Investor Emotion | Typical Market Action |
|---|---|---|
| Stealth Phase | Disbelief | Cautious accumulation by "smart money." Most people think the rally won't last. |
| Awareness Phase | Hope | Institutional investors start buying. The public begins to take notice. |
| Mania Phase | Optimism, Thrill, Euphoria | Everyone is buying. FOMO is rampant. "This time it's different!" |
| Blow-off Top | Complacency, Anxiety | Prices peak. The first signs of weakness appear, but most ignore them. |
| Cool-off Phase | Denial, Panic, Capitulation | Prices fall sharply. Investors sell at a loss just to get out. Maximum pain. |
| Consolidation | Anger, Depression | The market goes sideways. Most have lost interest and sworn off investing. |
Understanding these phases is the first step toward recognizing where you—and the broader market—are in the emotional cycle. It's about gaining perspective so you can act logically instead of emotionally.
The Upward Climb Through a Wall of Worry
After a market truly bottoms out, the first signs of recovery are almost never met with open arms and celebration. Instead, the initial phase of a new bull run kicks off with Disbelief. This first rally just feels wrong, like a temporary blip—a dead cat bounce—before the next leg down.
Most people, especially those still reeling from the financial and emotional pain of the crash, look at this early price movement with extreme suspicion. They write it off as a "sucker's rally," a trap for naive buyers before the floor falls out again. This is exactly why the so-called smart money often starts quietly accumulating here; they are buying when everyone else is paralyzed by fear.
But as the rally stubbornly continues and prices simply refuse to retest the old lows, that deep-seated disbelief slowly melts into Hope. The conversation starts to change. You'll hear investors cautiously wondering, "Hey, maybe that was the bottom after all?" This is a massive turning point on the market psychology chart.
The Wall of Worry Explained
This entire grind higher has a famous name: "climbing a wall of worry." It's a fantastic metaphor for the market's uncanny ability to push upward despite a firehose of negative headlines, awful economic numbers, and widespread doubt from just about everyone.
There's an old Wall Street saying: "The market climbs a wall of worry and slides down a slope of hope." It perfectly captures how bull markets are born from pessimism and die in euphoria. On the way up, every piece of bad news is seen as another reason not to invest, yet the market keeps climbing.
Just think back to the aftermath of the 2008 financial crisis or the brutal COVID-19 crash in March 2020. In both instances, the initial recovery was drowned out by fears of a double-dip recession, skyrocketing unemployment, and endless global uncertainty. And yet, the markets pushed relentlessly higher, leaving anyone waiting on the sidelines in the dust.
As prices break through old resistance levels, hope begins to harden into the next phase: Optimism. This is when the tide really turns. The masses of investors who were "waiting for confirmation" finally start jumping back in. The fear of losing money is slowly but surely being replaced by the fear of missing out (FOMO).
You can spot this transition by looking for a few key shifts:
- Improving Fundamentals: Suddenly, positive economic news starts to pop up, validating the price action that came before it.
- Shifting Media Tone: Financial news networks pivot from doom-and-gloom to a more cautiously optimistic narrative, which pulls in more public interest.
- Wider Participation: Retail investors and even hesitant institutional funds start deploying their cash, no longer content to sit on the sidelines.
This phase is what sets the stage for the much more powerful emotional stages of belief, thrill, and eventually, euphoria. Learning to spot the subtle shift from a skeptical "wall of worry" to genuine optimism is a critical skill for anyone using the market psychology chart. It helps you get positioned just before the real herd shows up.
Riding the Wave of Euphoria to the Peak
After climbing the "wall of worry," the mood of the market shifts in a big way. That early, hesitant optimism hardens into a firm sense of Belief. Investors who got in early now feel like geniuses. Their predictions are coming true, their portfolios are green, and they feel totally vindicated.
This confidence is contagious. It pulls more and more money off the sidelines, pushing prices even higher. You start seeing positive headlines everywhere, and suddenly, everyone at the barbecue is talking about their crypto gains. This is where belief morphs into something much more potent: Thrill.
In the thrill phase, making money feels laughably easy. Every minor dip gets snapped up in seconds. Investors, emboldened by their success, start taking on bigger risks. The memory of potential losses fades, replaced entirely by an intense fear of missing out (FOMO).
The Peak of Irrational Exuberance
This rising tide of excitement finally crashes into a state of pure Euphoria. This is, without a doubt, the most treacherous point in the entire market cycle. Logic and reason go out the window, completely replaced by the frantic chase for vertical price charts. Valuations are no longer tethered to reality; they're held up by nothing but pure, unadulterated greed.
You'll know you’re here when you see these classic warning signs:
- "This Time It's Different": People start justifying insane prices by claiming the old rules of investing no longer apply.
- Widespread Media Hype: The asset is on every financial news channel, and stories about instant millionaires are everywhere.
- Extreme Price Predictions: So-called experts are forecasting astronomical future prices, adding more fuel to the fire.
- Maximum Public Participation: Your taxi driver, your barista, your cousin who never invested a dime—they're all suddenly experts and are all-in.
This is the point of maximum financial risk. When everyone is convinced an asset is a surefire bet and can only go up, the market has likely run out of new buyers. The only people left to sell to are those who bought earlier.
Remember the Dot-Com bubble? Unprofitable internet startups were fetching billion-dollar valuations. Or think about any of the big crypto bull runs, where unknown coins with no real use case would skyrocket thousands of percent. In every case, euphoria had convinced the masses that the fundamental laws of finance had been suspended.
Learning to spot this peak for what it truly is—a fragile high built on emotion, not fundamentals—is one of the most important skills you can develop. The transition from euphoria to the next phase, complacency, often starts quietly. But it signals the beginning of the long, painful trip down the other side of the market psychology chart, where all those easy profits can disappear in a flash.
The Long, Painful Slide from the Top
After the party hits its peak, nobody wants to be the first to leave. This is the Complacency phase. The market stops making new highs, maybe even pulls back a bit, but the crowd isn't worried. Everyone just sees it as a healthy correction, a chance to catch a breath before the next leg up. It feels safe, but it's a dangerous illusion.
That calm feeling doesn't last. As the dip gets a little deeper, Anxiety starts to creep in. Those easy, overnight gains are gone. Now, investors are nervously checking their portfolios, watching their profits slowly evaporate. The unwavering confidence is gone, replaced by a nervous hope that things will turn around any second.
But they don't. As prices keep falling, anxiety hardens into Denial. This is a powerful, self-preservation instinct kicking in. People who bought near the top simply can't accept they made a bad call. You'll hear them say things like, "I'm buying the dip!" or "This is a great buying opportunity." They might even add to their positions, doubling down on a mistake, convinced a sharp recovery is just around the corner.
From Denial to Outright Panic
The market, however, doesn't care about anyone's feelings. Denial shatters when a critical support level gives way or a wave of bad news hits the headlines, fueling the fire. This is when Panic takes over. All logic flies out the window, replaced by pure, unfiltered fear.
Suddenly, everyone is a seller. The so-called "long-term holders" are now hitting the sell button as fast as they can, just trying to salvage whatever is left. The only goal is to get out, and this mad dash for the exits creates a downward spiral, pushing prices off a cliff.
This isn't just something that happens in crypto. It’s a timeless human reaction. Studies of major market crashes, like the Dot-Com Bubble and the 2007–2009 Global Financial Crisis, show that investor risk aversion shot up by 20-30 percentage points above normal levels. You can dig into more data on global risk aversion trends to see how these patterns repeat.
What is Capitulation? It’s the breaking point. It's that moment of maximum financial pain where even the most die-hard believers finally give up. They throw in the towel and sell everything at a massive loss, utterly convinced the asset is going to zero.
Hitting Rock Bottom
This final, gut-wrenching wave of selling is called Capitulation. You can often spot it on a chart by a massive spike in trading volume as the last of the weak hands are forced out. It’s brutal, but this cleansing is a necessary part of the cycle. It means the selling pressure is finally running out of steam.
What follows is Despair and Depression. The asset is now a pariah. Anyone who lost money swears they'll never touch it again. The market goes quiet, trading sideways with very little volume. It’s in this gloomy, forgotten landscape—completely stripped of hype and emotion—that the seeds of the next bull market are sown, waiting for the first signs of disbelief to sprout once more.
Cognitive biases are the invisible puppet masters pulling the strings behind these emotional swings. They are systematic errors in thinking that cause us to misinterpret information and make irrational decisions—especially when our money is on the line. Understanding them is key to not getting swept away by the crowd.
Below is a table breaking down some of the most common biases and how they show up during different market phases.
Psychological Biases in Market Cycles
| Cognitive Bias | Description | Impact on Trading Decisions |
|---|---|---|
| Confirmation Bias | The tendency to seek out and favor information that confirms pre-existing beliefs. | During Denial, an investor will only read news that supports their "buy the dip" thesis and ignore bearish signals. |
| Herding | Following the actions of a larger group, regardless of individual analysis. | Drives both the Euphoria peak (FOMO) and the Panic selling as everyone rushes for the exit at once. |
| Anchoring Bias | Over-relying on the first piece of information received (like the peak price). | Investors anchor to the all-time high, believing the price "should" return there, causing them to hold on too long. |
| Loss Aversion | The tendency for the pain of losing to be psychologically twice as powerful as the pleasure of gaining. | This fuels Panic selling. The fear of further losses becomes so overwhelming that investors sell at any price to stop the pain. |
| Overconfidence | An investor's belief that their own skill and judgment are better than they actually are. | Rampant during Euphoria, leading people to take on excessive risk, believing they can't lose. |
Recognizing these biases in your own thinking is the first step toward becoming a more disciplined and rational market participant. It helps you separate your emotions from your strategy, which is often the deciding factor between profit and loss.
Applying the Chart to Your Trading Strategy
Knowing the emotional rollercoaster of the market psychology chart is one thing. Actually using it to make better trades? That’s where the real work begins. This is where theory gets put into practice.
Let's be clear: this chart isn't a crystal ball that perfectly predicts market tops and bottoms. Instead, think of it as an emotional compass for the market. It gives you invaluable context, helping you understand whether the crowd is being driven by greed or by fear. When you pair that insight with hard data from technical indicators, you can seriously sharpen your trading edge.
Your technical indicators are the tools that measure the strength of a price move. The psychology chart tells you why the move might be happening. Using them together lets you confirm what the crowd is feeling with what the data is actually showing.

This whole approach is built on a simple truth: human behavior is one of the most powerful forces in any market. Studies have confirmed time and again that our psychological biases directly warp market prices, completely shattering the old textbook idea that everyone acts rationally all the time.
Combining Sentiment with Technical Indicators
To make this chart truly useful, you have to pair its emotional story with cold, hard data points. This is how you validate your gut feeling about where we are in the emotional cycle.
Here are a few key indicators I always keep an eye on:
Volume: This is probably the most direct way to see emotional intensity. A massive spike in trading volume during the Capitulation phase is often the sign of a "washout" bottom—the point where the last of the panic-sellers have finally given up and thrown in the towel. On the flip side, if volume starts drying up as prices are screaming higher into Euphoria, it can be a major red flag that the rally is running out of gas.
Relative Strength Index (RSI): The RSI is all about momentum, measuring the speed and change of price moves to spot overbought or oversold conditions. A classic warning sign is a bearish divergence during the Euphoria phase. This happens when the price hits a new high, but the RSI makes a lower high, telling you the upward momentum is secretly fading.
Moving Averages: These are great for smoothing out the noise and seeing the real underlying trend. A "death cross" is a perfect example. This is when a short-term moving average (like the 50-day) crosses below a long-term one (like the 200-day). It often happens right in the middle of the Panic phase, confirming that a major trend reversal is underway.
The Contrarian's Edge: The most powerful way to use this chart is as a contrarian. It gives you the conviction to buy when there’s "blood in the streets" (the Despair phase) and to take profits when everyone else is bragging about their gains (Euphoria). It's all about moving against the overwhelming emotional tide.
Actionable Tips for Different Trading Styles
How you use these insights really comes down to your own goals. Long-term investors and short-term traders can both find an edge here, but they'll be playing the game differently.
For Long-Term Investors:
Your game is all about finding points of maximum opportunity. You're looking to use the chart to patiently build positions during the Anger and Depression phases. This is when fantastic assets get incredibly cheap simply because nobody wants to touch them. Patience is your superpower.
For Short-Term Traders:
You’re here to capitalize on the wild swings at the emotional extremes. For traders who are comfortable with risk, the Panic and Capitulation phases can offer some incredible high-reward entry points for quick bounce plays. If you prefer a more hands-on approach, digging into the details of https://blockbee.io/blog/post/what-is-spot-trading-in-crypto can give you a solid framework for executing these kinds of trades.
At the end of the day, using the market psychology chart effectively comes down to one thing: you have to master your investment decision-making process. When you can do that, you ensure your moves are guided by cool-headed analysis, not crowd-driven emotion. That discipline is what turns this chart from an interesting idea into a genuinely profitable tool.
Got Questions? Let's Talk Market Psychology
Even after you've got the phases down, it's natural to have questions about how this chart works in the real world. The best way to think about it isn't as a crystal ball that predicts the future. It’s more like a weather map for market sentiment; it shows you the emotional climate so you can make smarter moves.
Let's clear up some of the most common questions traders have about putting this powerful concept into action.
Can This Chart Call Market Tops and Bottoms?
This is the big one, and the short answer is no—not with perfect accuracy, anyway. No single tool can do that.
The chart’s true value isn’t in giving you an exact price to buy or sell. Its real power is in helping you spot periods of maximum financial risk (when everyone is euphoric and buying like there's no tomorrow) and maximum financial opportunity (when everyone is panicking and selling in despair).
Think of it as a roadmap for crowd emotion. You still need other tools. A smart trader layers these insights with solid technical analysis—like volume or RSI—and a bulletproof risk management strategy. The chart tells you what the herd is feeling, and your other indicators help confirm if that feeling is actually moving the market in a sustainable way.
Is This Chart Still Relevant Today?
With so many trades being executed by algorithms and high-frequency bots, it's fair to ask if human emotion even matters anymore. The answer is a huge, unqualified yes.
Here's why: even though machines place a ton of trades, those algorithms are still built by humans. They’re often programmed to react to patterns—like sudden spikes in volatility or momentum—that are created by human behavior in the first place.
Plus, the rise of retail investing, especially in wild markets like crypto, means more everyday people are in the game than ever before. These markets are pure, uncut human emotion, often showing incredibly intense and fast-forwarded emotional cycles. This makes the market psychology chart more relevant than ever.
Key Insight: The technology and the assets will always change. Human psychology, however, is the one constant in the market. The fundamental drivers of greed and fear never go out of style, which is why these principles hold up, decade after decade.
Does This Apply to Different Markets, Like Stocks vs. Crypto?
People often wonder if the emotional cycle works the same for blue-chip stocks as it does for a volatile altcoin. The core psychological pattern is universal—it’s based on human nature, not the asset itself.
But the speed and intensity of that cycle can be wildly different.
- Stocks: For a broad index like the S&P 500, a full market cycle might take years to unfold.
- Cryptocurrencies: In the crypto world, a single coin can go from disbelief to despair and back again in just a few months, with absolutely gut-wrenching price swings.
The feelings of FOMO and panic are identical, but the crypto market is basically the classic market psychology chart on fast-forward. For any business in the crypto space, understanding these rapid shifts in sentiment is a matter of survival. For instance, knowing how to accept crypto payments for your business means being ready for huge customer interest during bull runs and knowing how to navigate the quiet periods during downturns.
At the end of the day, avoiding the emotional pitfalls on this chart boils down to one thing: discipline. Have a plan. Set your entry and exit points before you get in the game. That's how you protect yourself from getting swept up by the madness of the crowd.
Ready to streamline your business's crypto transactions with a secure, non-custodial solution? BlockBee offers a robust payment gateway with low fees, instant payouts, and seamless integration with major e-commerce platforms. Get started today at https://blockbee.io.